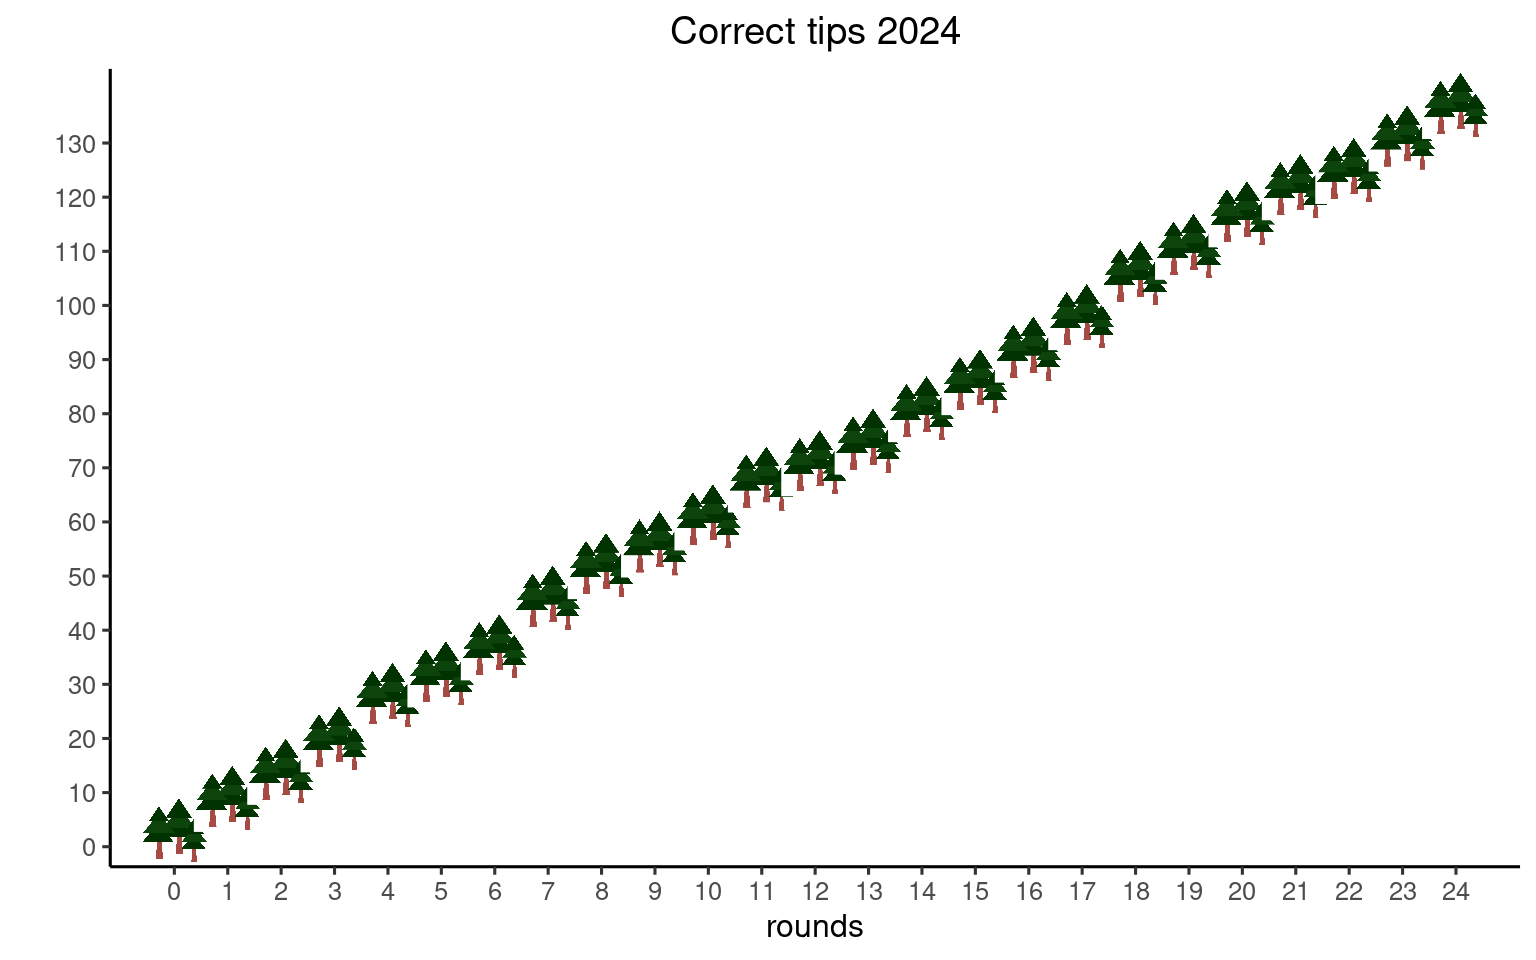
Correct tips
51
Accuracy
63%
Top percentile of AFL footy tipping
35%
Welcome to the Footy Forest. Here you’ll find predictions, details on how the model is performing, rankings of each team and occasional statistical analyses of AFL footy and other sports.
| Home | Away | Relative advantage to the home team1 | Predicted winner | Probability | Margin | |||
|---|---|---|---|---|---|---|---|---|
| Power | Venue exp | Team rating | Travel | |||||
| Fremantle | Collingwood | −25 | 60 | 0 | 75 | Collingwood | 59 | 11 |
| St Kilda | Carlton | −16 | −3 | 6 | 0 | Carlton | 56 | 9 |
| Melbourne | Hawthorn | −40 | 19 | −5 | 0 | Hawthorn | 74 | 36 |
| Essendon | Sydney Swans | −20 | 38 | 30 | 20 | Sydney Swans | 62 | 15 |
| Gold Coast Suns | Western Bulldogs | −12 | 2 | 10 | 7 | Western Bulldogs | 52 | 5 |
| Port Adelaide | Adelaide Crows | −29 | −6 | 4 | 0 | Adelaide Crows | 70 | 25 |
| Richmond | West Coast Eagles | 3 | 89 | 36 | 75 | Richmond | 70 | 17 |
| Geelong Cats | GWS Giants | 0 | 61 | 6 | 21 | Geelong Cats | 69 | 15 |
| North Melbourne | Brisbane Lions | −43 | 24 | −2 | 33 | Brisbane Lions | 75 | 36 |
| 1 Relative advantage to the home team scaled from -100 to +100 www.footyforest.com | ||||||||